Valuing Indexation Flexibilities in X-LNG
Check out the full detailed analysis here
What we analyzed
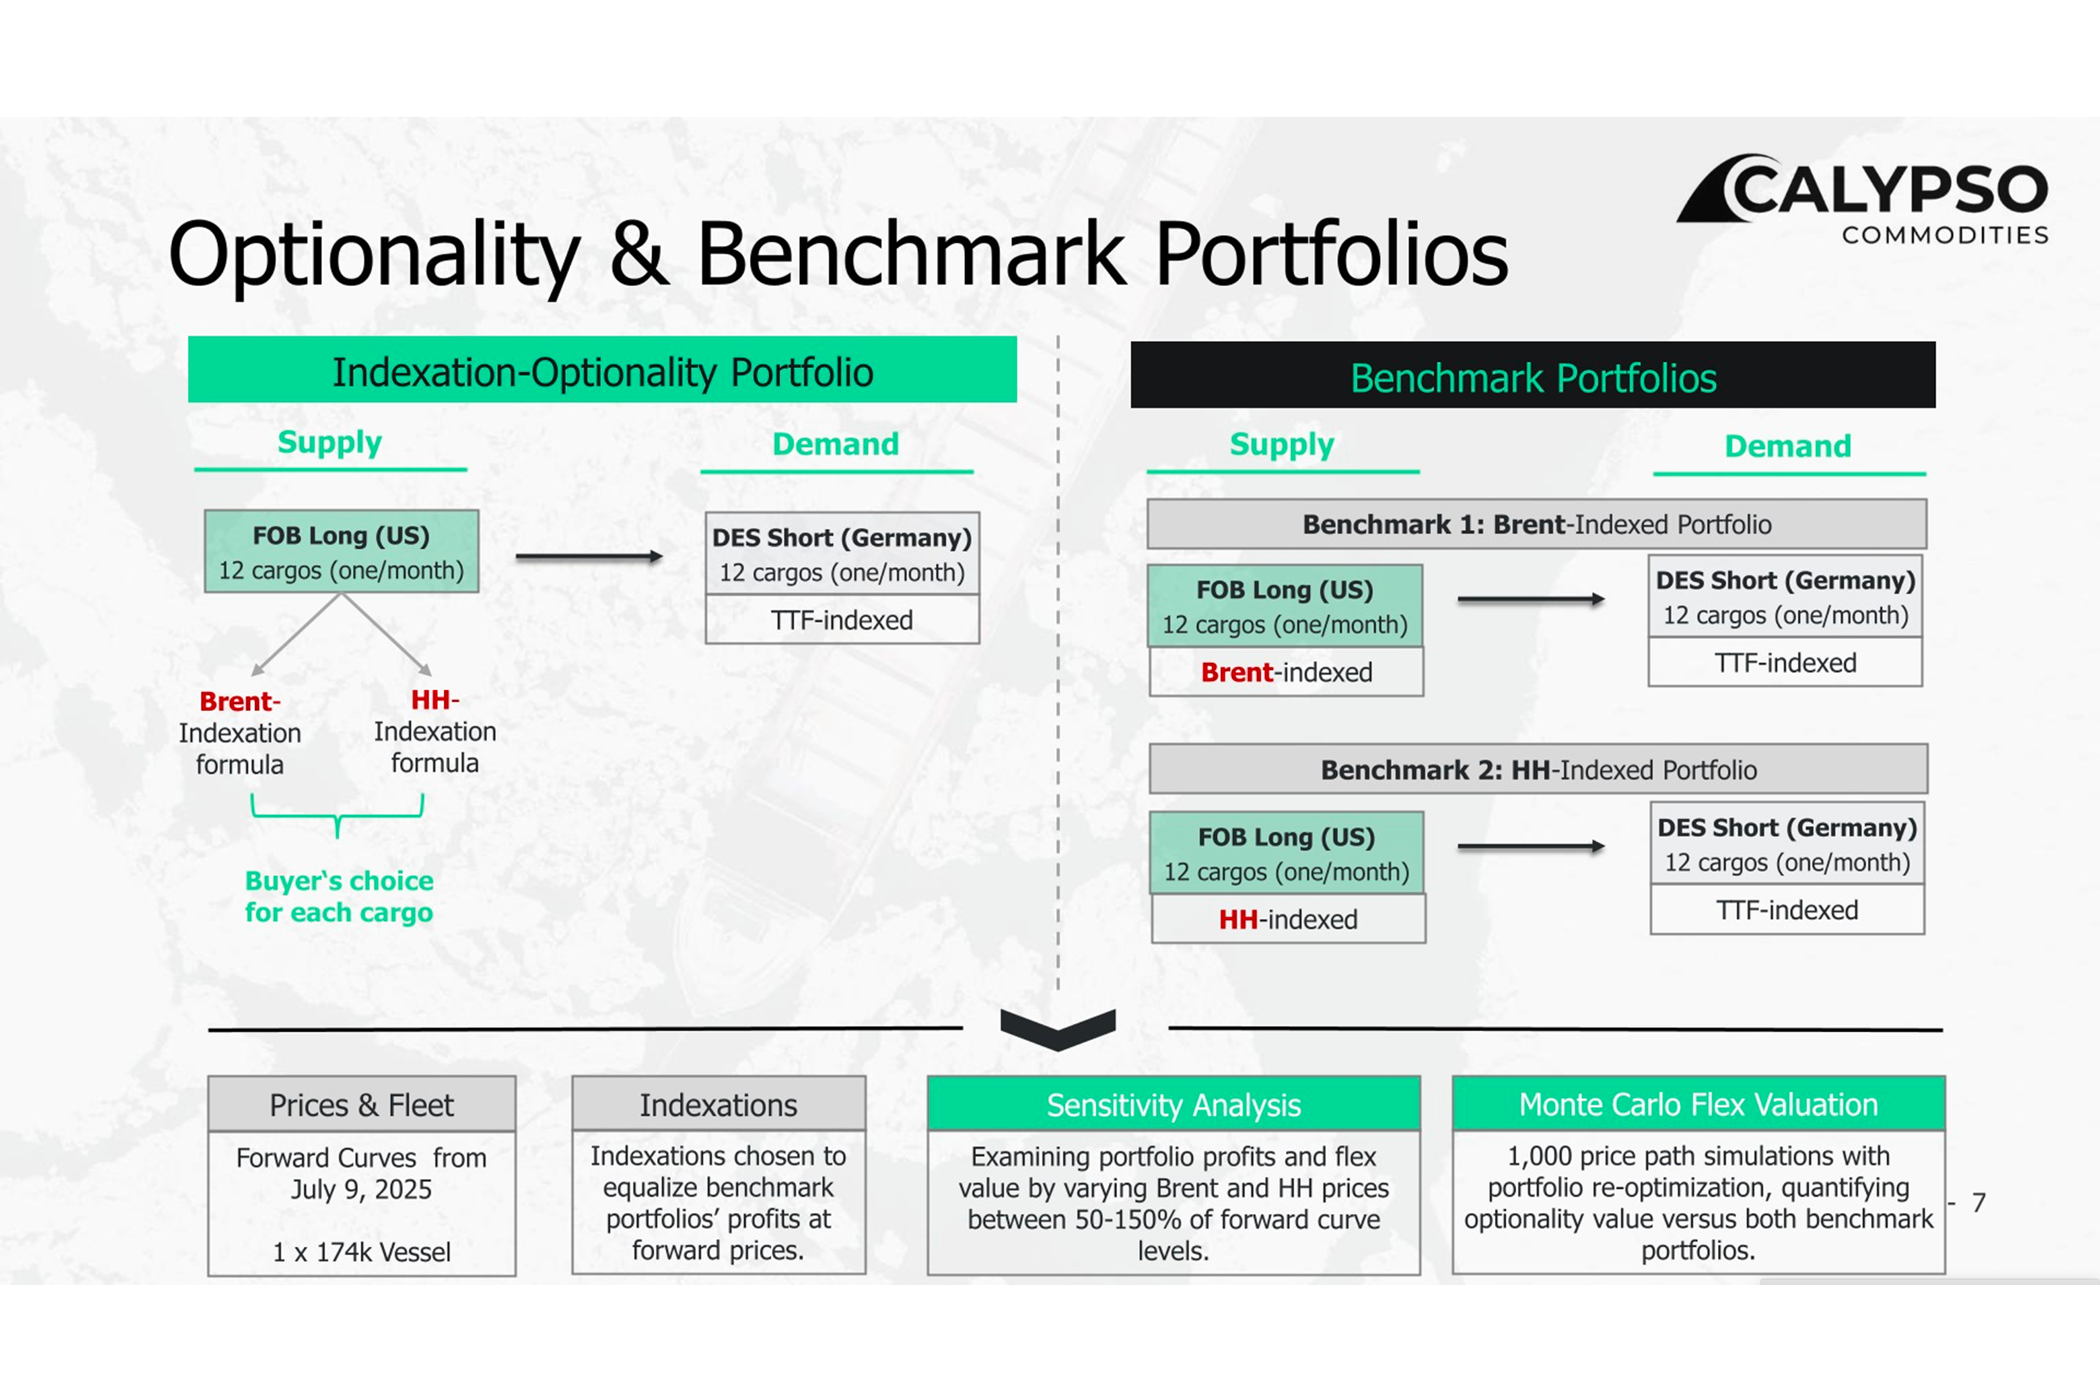
- Three comparable setups:
- Benchmark A: Henry Hub–indexed portfolio (no flex)
- Benchmark B: Brent‑indexed portfolio (no flex)
- Indexation‑Optionality Portfolio: right to settle each cargo on the more economic of the two index formulas
- Apples‑to‑apples calibration: At current forward curves the two benchmark portfolios are set to similar profitability, putting the option “at‑the‑money” so we isolate extrinsic value.
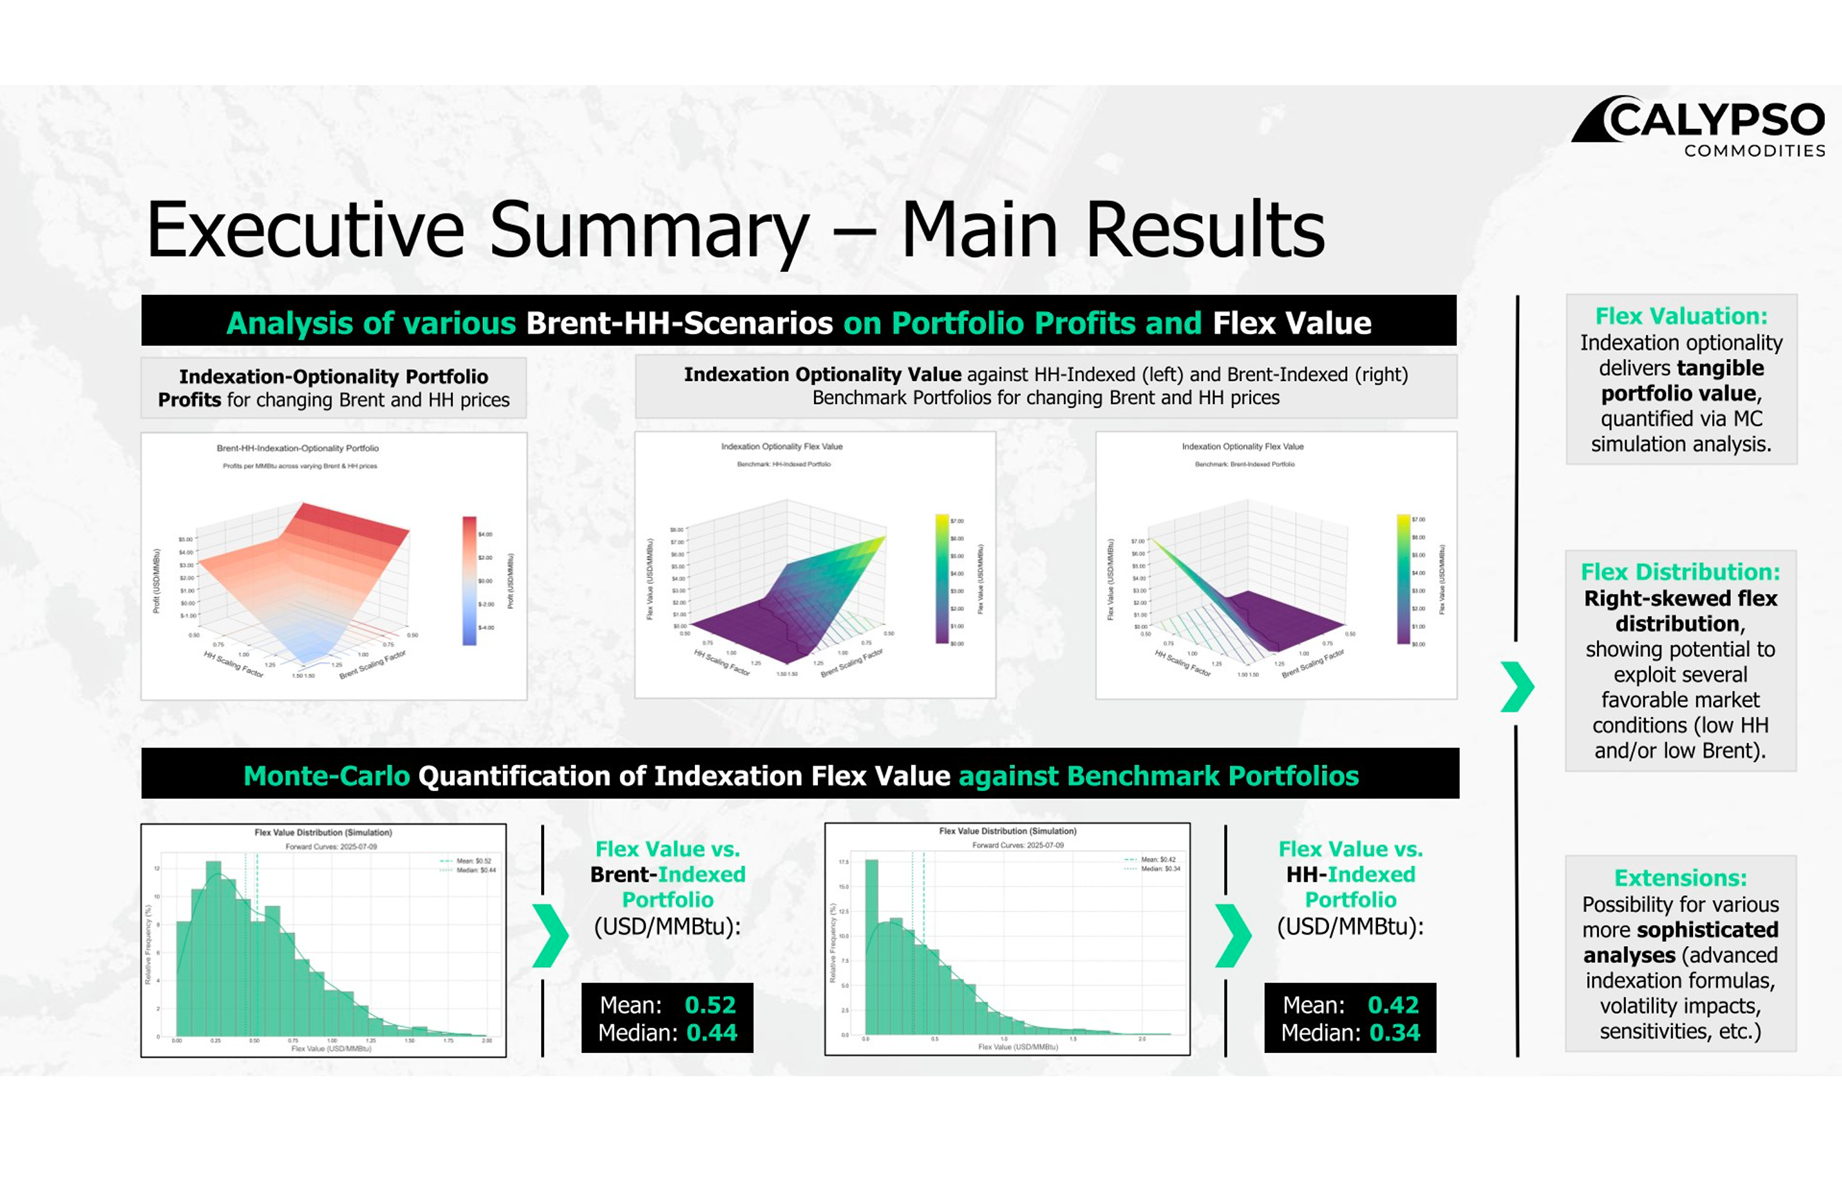
- Method:1,000 realistic simulations for Brent and HH; profit‑sensitivity surfaces map bi‑dimensional exposure and optimization logic.


Key takeaways
- Consistent structural edge: The flexible portfolio significantly outperforms both benchmarks by “arbitraging” between pricing regimes as markets move.
- Quantified performance: Across simulations, the Indexation‑Optionality Portfolio delivers mean profits of $0.52/MMBtu compared to the Brent-Benchmark Portfolio and $0.44/MMBtu compared to the HH-Benchmark Portfolio.
- Why it works: Optionality captures volatility and the asymmetric effects of different index formulas (e.g., a% HH + b vs. c% Brent), selecting the best settlement state‑by‑state.
- Practical insight: Sensitivity surfaces reveal where Brent vs. HH strength flips the optimal choice, guiding hedging and deal‑design.
Who benefits from this
- Traders: Turn price dispersion into P&L by dynamically settling on the advantaged index; use the surfaces to time hedges.
- Origination/Structuring: Price, design, and negotiate index‑switch rights; evidence‑based justification for premiums and triggers.
- Portfolio & Risk teams: Reduce concentration to a single index, monetize volatility, and stress‑test under alternative curve/volatility scenarios.
- Finance & Strategy: Support fair‑value assessments and capital allocation with simulation‑based distributions rather than point estimates.
Why it matters now
- Forward curves can make single‑index deals look equivalent today, but realized volatility creates material extrinsic value that standard benchmarking misses.
- The same framework extends to alternative formulas and additional indices, allowing tailored negotiation packs and risk overlays.

.svg)
Legal Notice
Impressum
Angaben gemäß § 5 TMG
Calypso Ventures GmbH
Bismarckstraße 10/12
10625 Berlin
Handelsregister: HRB 239736 B
Amtsgericht Charlottenburg
Umsatzsteuer: DE342781749
Vertreten durch:
Michael Schach
Kontakt
Telefon: +49 30 41734423
E-Mail: [email protected]
Nutzungsvereinbarungen
Imprint
Disclosures according to German law § 5 TMG
Calypso Ventures GmbH
Bismarckstraße 10/12
10625 Berlin
Registered number: HRB 239736 B
Amtsgericht Charlottenburg (Germany)
VAT: DE342781749
Represented by:
Michael Schach
Contact
Phone: +49 30 41734423
E-Mail: [email protected]
User Agreements
Valuing Indexation Flexibilities in X-LNG

Check out the full detailed analysis here
What we analyzed
- Three comparable setups:
- Benchmark A: Henry Hub–indexed portfolio (no flex)
- Benchmark B: Brent‑indexed portfolio (no flex)
- Indexation‑Optionality Portfolio: right to settle each cargo on the more economic of the two index formulas
- Apples‑to‑apples calibration: At current forward curves the two benchmark portfolios are set to similar profitability, putting the option “at‑the‑money” so we isolate extrinsic value.
- Method:1,000 realistic simulations for Brent and HH; profit‑sensitivity surfaces map bi‑dimensional exposure and optimization logic.

Key takeaways
- Consistent structural edge: The flexible portfolio significantly outperforms both benchmarks by “arbitraging” between pricing regimes as markets move.
- Quantified performance: Across simulations, the Indexation‑Optionality Portfolio delivers mean profits of $0.52/MMBtu compared to the Brent-Benchmark Portfolio and $0.44/MMBtu compared to the HH-Benchmark Portfolio.
- Why it works: Optionality captures volatility and the asymmetric effects of different index formulas (e.g., a% HH + b vs. c% Brent), selecting the best settlement state‑by‑state.
- Practical insight: Sensitivity surfaces reveal where Brent vs. HH strength flips the optimal choice, guiding hedging and deal‑design.

Who benefits from this
- Traders: Turn price dispersion into P&L by dynamically settling on the advantaged index; use the surfaces to time hedges.
- Origination/Structuring: Price, design, and negotiate index‑switch rights; evidence‑based justification for premiums and triggers.
- Portfolio & Risk teams: Reduce concentration to a single index, monetize volatility, and stress‑test under alternative curve/volatility scenarios.
- Finance & Strategy: Support fair‑value assessments and capital allocation with simulation‑based distributions rather than point estimates.
Why it matters now
- Forward curves can make single‑index deals look equivalent today, but realized volatility creates material extrinsic value that standard benchmarking misses.
- The same framework extends to alternative formulas and additional indices, allowing tailored negotiation packs and risk overlays.

.svg)
Legal Notice
Impressum
Angaben gemäß § 5 TMG
Calypso Ventures GmbH
Bismarckstraße 10/12
10625 Berlin
Handelsregister: HRB 239736 B
Amtsgericht Charlottenburg
Umsatzsteuer: DE342781749
Vertreten durch:
Michael Schach
Kontakt
Telefon: +49 30 41734423
E-Mail: [email protected]
Nutzungsvereinbarungen
Imprint
Disclosures according to German law § 5 TMG
Calypso Ventures GmbH
Bismarckstraße 10/12
10625 Berlin
Registered number: HRB 239736 B
Amtsgericht Charlottenburg (Germany)
VAT: DE342781749
Represented by:
Michael Schach
Contact
Phone: +49 30 41734423
E-Mail: [email protected]
User Agreements


.svg)
