

Portfolio Valuation Case Study: Assessing Portfolio Resilience Under Varied Price Volatility
Check out the full detailed analysis here
Stage 1: Status quo
Supply (2026):
- Australia (Gorgon), 3 cargos
- Australia (Pluto), 4 cargos
- Australia (Queensland Curtis), 2 cargos
- Peru, 12 cargos
Demand (2026):
- China, 17 cargos
- JKTC spot
Fleet:
- 3 × 174k vessels
Stage 2: Adding US supply
Supply (2026):
- Stage 1 contracts
- + 69 FOB Longs from US (Port Arthur)
Demand (2026):
- Stage 1 contracts
- + China, 17 cargos
- + Germany, 34 cargos
- NWE spot
Fleet:
- 10 × 174k vessels
Stage 3: Adding Africa and Middle East supply
Supply (2026):
- Stage 2 contracts
- + 21 FOB Longs from Tanzania
- + 29 FOB Longs from UAE
Demand (2026):
- Stage 2 contracts
Fleet:
- 15 × 174k vessels
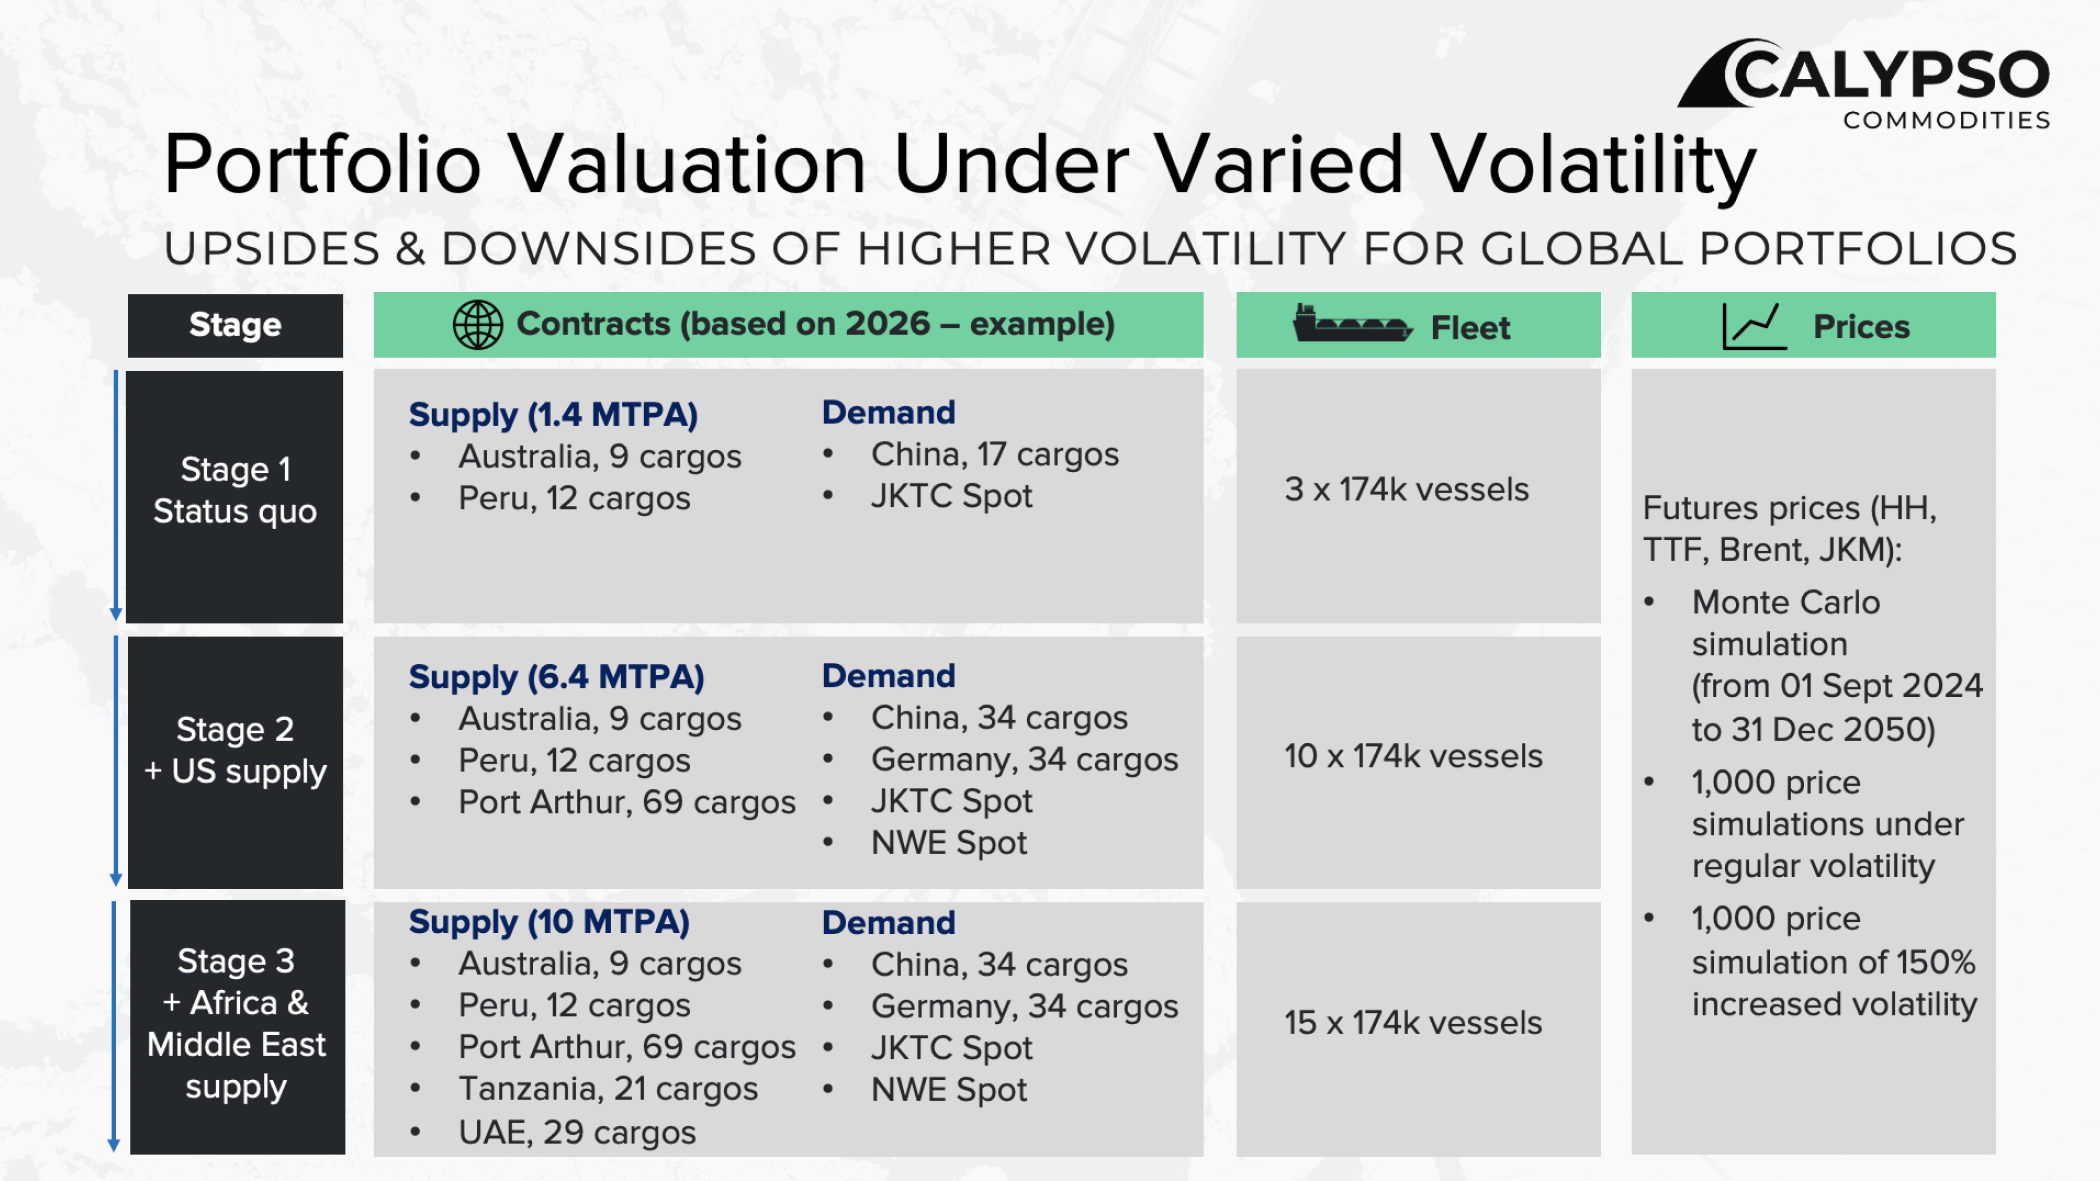
Two Levels of Price Volatility
The same sets of futures price for 2026 with two different levels of price volatility are used for the three stages of portfolios
- Futures prices for HH, TTF, Brent and JKM based on Monte Carlo simulation
- 1,000 price simulations under regular volatility
- 1,000 price simulations of 150% increased volatility
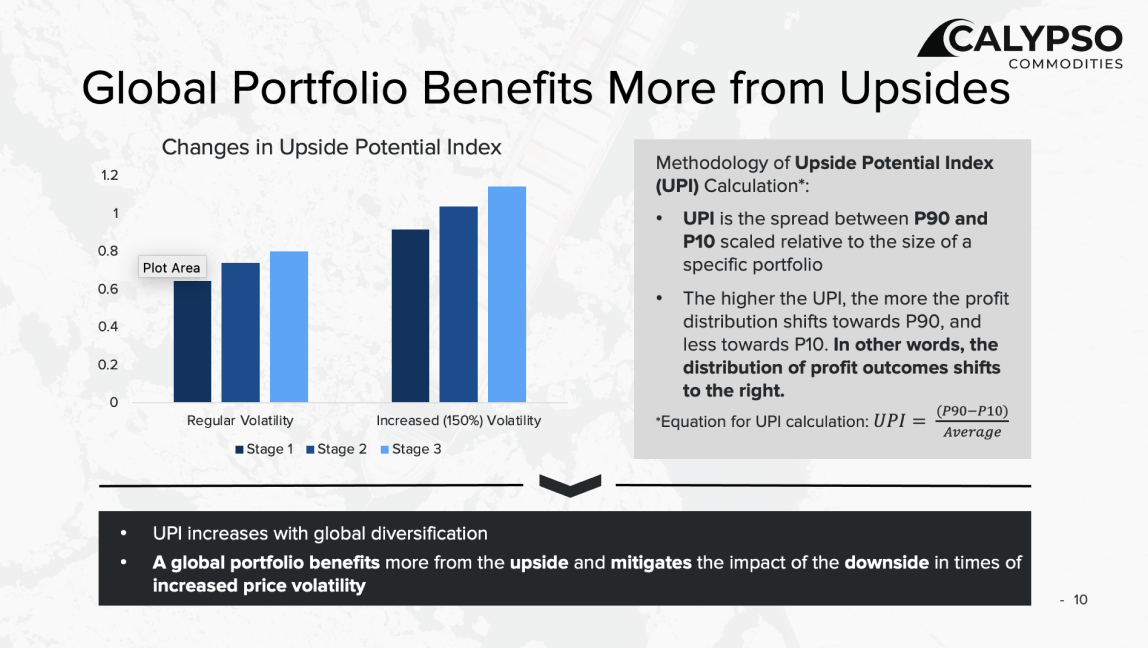
Global Portfolio Benefits More from Upsides
A metric called the Upside Potential Index (UPI), which is the difference between the 90th and 10th percentile profit outcomes adjusted for portfolio size, is introduced and used to assess portfolio resilience. The higher the UPI, the more the profit distribution shifts towards P90 and less towards P10.
By comparing the UPI of portfolios at three different stages, it is observed that UPI increases with global diversification. Adding global supply amplifies portfolio resilience, increasing the upside potential while decreasing the downside risk.

.svg)
Legal Notice
Impressum
Angaben gemäß § 5 TMG
Calypso Ventures GmbH
Bismarckstraße 10/12
10625 Berlin
Handelsregister: HRB 239736 B
Amtsgericht Charlottenburg
Umsatzsteuer: DE342781749
Vertreten durch:
Michael Schach
Kontakt
Telefon: +49 30 41734423
E-Mail: [email protected]
Nutzungsvereinbarungen
Imprint
Disclosures according to German law § 5 TMG
Calypso Ventures GmbH
Bismarckstraße 10/12
10625 Berlin
Registered number: HRB 239736 B
Amtsgericht Charlottenburg (Germany)
VAT: DE342781749
Represented by:
Michael Schach
Contact
Phone: +49 30 41734423
E-Mail: [email protected]
User Agreements
Portfolio Valuation Case Study: Assessing Portfolio Resilience Under Varied Price Volatility
Check out the full detailed analysis here
Stage 1: Status quo
Supply (2026):
- Australia (Gorgon), 3 cargos
- Australia (Pluto), 4 cargos
- Australia (Queensland Curtis), 2 cargos
- Peru, 12 cargos
Demand (2026):
- China, 17 cargos
- JKTC spot
Fleet:
- 3 × 174k vessels
Stage 2: Adding US supply
Supply (2026):
- Stage 1 contracts
- + 69 FOB Longs from US (Port Arthur)
Demand (2026):
- Stage 1 contracts
- + China, 17 cargos
- + Germany, 34 cargos
- NWE spot
Fleet:
- 10 × 174k vessels
Stage 3: Adding Africa and Middle East supply
Supply (2026):
- Stage 2 contracts
- + 21 FOB Longs from Tanzania
- + 29 FOB Longs from UAE
Demand (2026):
- Stage 2 contracts
Fleet:
- 15 × 174k vessels
Two Levels of Price Volatility
The same sets of futures price for 2026 with two different levels of price volatility are used for the three stages of portfolios
- Futures prices for HH, TTF, Brent and JKM based on Monte Carlo simulation
- 1,000 price simulations under regular volatility
- 1,000 price simulations of 150% increased volatility
Global Portfolio Benefits More from Upsides
A metric called the Upside Potential Index (UPI), which is the difference between the 90th and 10th percentile profit outcomes adjusted for portfolio size, is introduced and used to assess portfolio resilience. The higher the UPI, the more the profit distribution shifts towards P90 and less towards P10.
By comparing the UPI of portfolios at three different stages, it is observed that UPI increases with global diversification. Adding global supply amplifies portfolio resilience, increasing the upside potential while decreasing the downside risk.
Legal Notice
Impressum
Angaben gemäß § 5 TMG
Calypso Ventures GmbH
Bismarckstraße 10/12
10625 Berlin
Handelsregister: HRB 239736 B
Amtsgericht Charlottenburg
Umsatzsteuer: DE342781749
Vertreten durch:
Michael Schach
Kontakt
Telefon: +49 30 41734423
E-Mail: [email protected]
Nutzungsvereinbarungen
Imprint
Disclosures according to German law § 5 TMG
Calypso Ventures GmbH
Bismarckstraße 10/12
10625 Berlin
Registered number: HRB 239736 B
Amtsgericht Charlottenburg (Germany)
VAT: DE342781749
Represented by:
Michael Schach
Contact
Phone: +49 30 41734423
E-Mail: [email protected]