
CASE STUDIES / ORIGINATION · AUG 2024
Australia beats Middle East under demand skews.
Expanding a Sabine Pass to Gate base book with new supply and demand, then stress-testing Australian against Middle Eastern FOB length across demand swings, a Red Sea closure and seasonal spreads.
$238.4M
BASE PORTFOLIO PROFIT · SABINE PASS TO GATE, 22 CARGOES
The base book and two suitors.
01 · THE SETUP
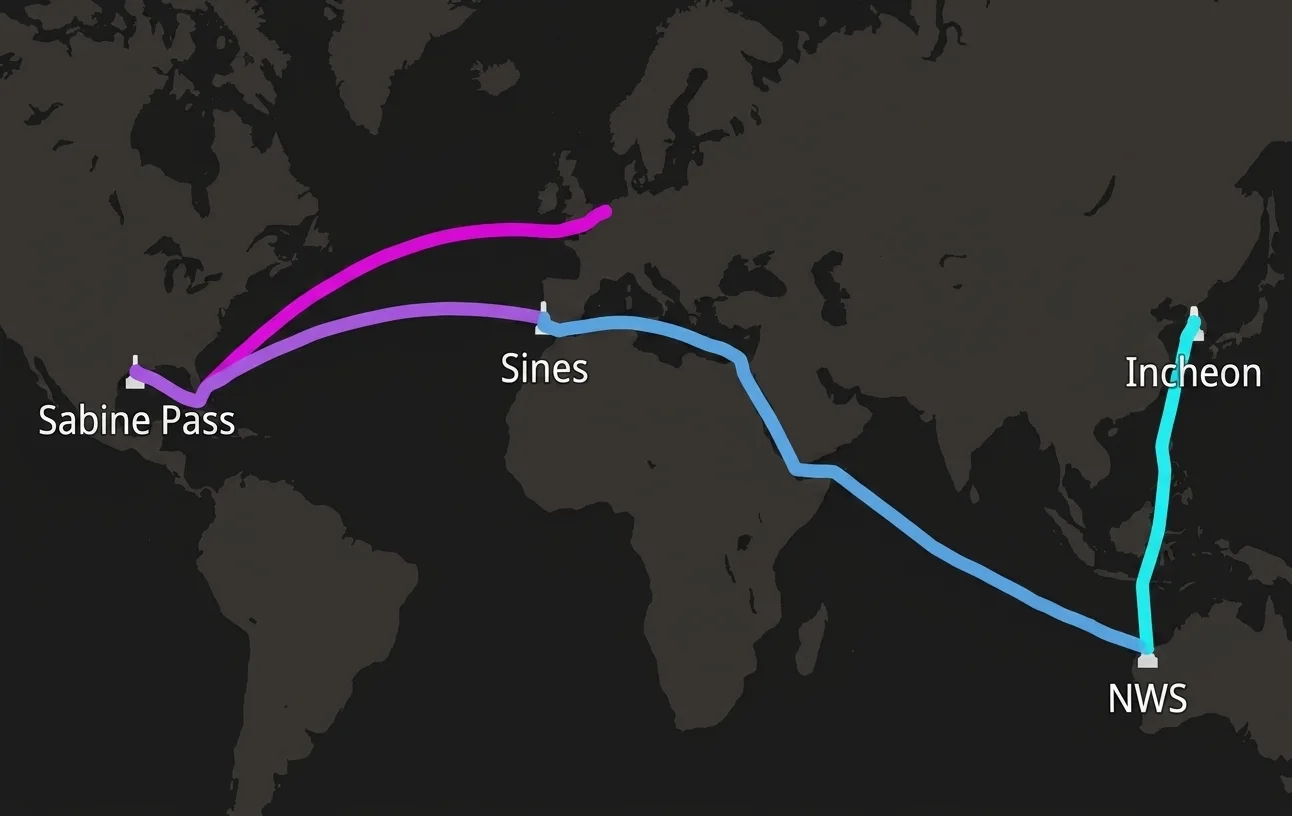
The base book ships 22 Sabine Pass cargoes to Gate on two 174K vessels, worth $238,435,281. It is expanded with a NWE DES-Long strip plus Portuguese and Korean demand, then offered four cargoes of new supply from either Australia or the Middle East.
THE BASE BOOK, EXPANDED
- 22 Sabine Pass cargoes to Gate: 115% HH + $3.5 tolling into 90% TTF
- Plus 4 DES Longs with NWE flex (90% TTF)
- Plus 4 DES Shorts at Sines (85% TTF) and 4 at Incheon (100% JKM)
- Fleet: 2 x 174K vessels + 1 TC-in
THE TWO SUITORS · 4 FOB CARGOES EACH
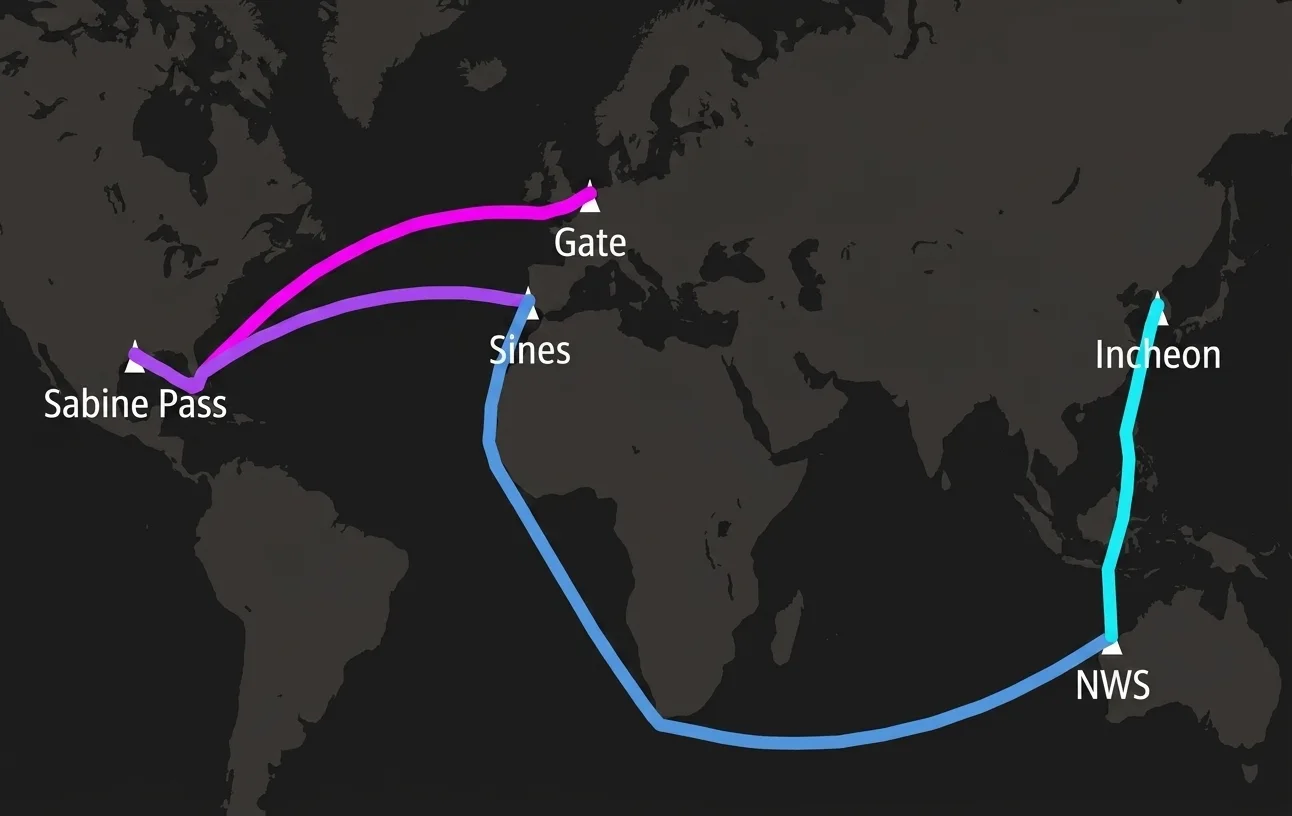
- Option A: North West Shelf, Australia, at 94.5% JKM minus $3.75
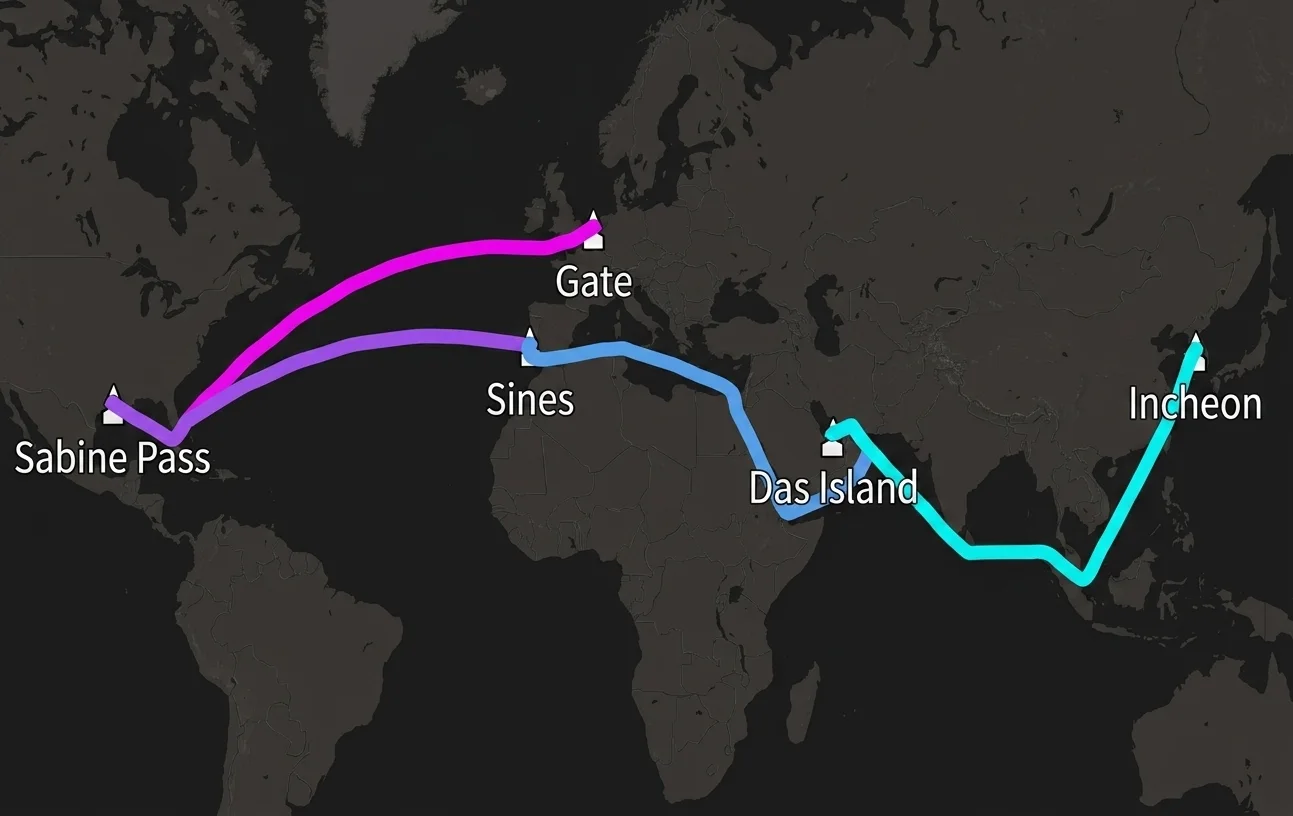
- Option B: Das Island, Middle East, at 11% Brent
- Same book, same demand, only the new supply hub differs
FULL YEAR 2025 · FORWARD CURVES HH, TTF, JKM AND BRENT · OPTIMISED SCHEDULE PER SCENARIO
At the curve, a near tie.
02 · FIRST SIGHT
Adding the four new cargoes, both sources land within two percent of each other. First-sight P&L says the choice barely matters. The stress tests say otherwise.
EXACT ENGINE RESULTS: AUSTRALIA $273,208,244 · MIDDLE EAST $268,032,172 · BASE $238,435,281
Demand skews pick Australia.
03 · THE STRESS
When demand shifts between Portugal and Korea, Australia wins most scenarios because it serves Korean demand better. Only the winter skew flips the sign.
AUSTRALIA'S EDGE OVER THE MIDDLE EAST, PER SCENARIO · $M
DEMAND SKEWS AS 6-VS-2 CARGO SPLITS · EXACT ENGINE RESULTS: PORTUGAL-HEAVY $256,738,177 VS $249,420,655 · KOREA-HEAVY $287,963,212 VS $287,620,889 · SUMMER $245,019,585 VS $240,060,053 · WINTER $244,024,551 VS $248,678,414
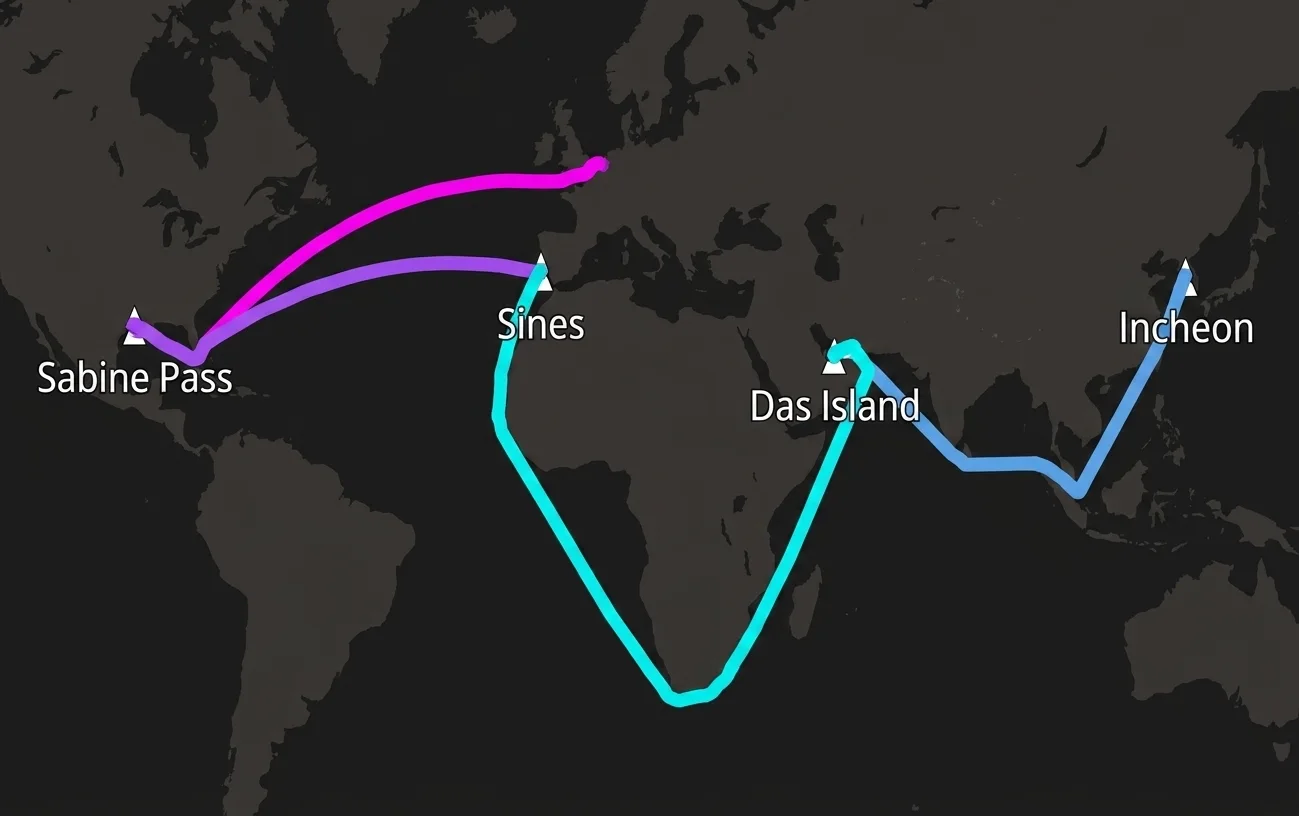
The Red Sea closure taxes Europe.
04 · RED SEA
A Red Sea closure costs the Australian book $4.6M and the Middle East book $3.9M whenever Europe is the heavy side, because the eastern supply has to sail around the Cape.
-$4.6M
AUSTRALIAN BOOK · $256.7M TO $252.2M
-$3.9M
MIDDLE EAST BOOK · $249.4M TO $245.5M
EUROPE
THE HIT LANDS WHENEVER EUROPE IS THE HEAVY SIDE
One index towers over the rest.
05 · VOLATILITY
A one-standard-deviation move in TTF swings this book by over half a billion dollars, five times the Henry Hub range. JKM exposure is naturally hedged by the Korean leg buying and selling on the same index.
PROFIT RANGE = ONE STD DEV ABOVE VS BELOW THE OPTIMISED VALUATION · STD DEVS YTD
06 · THE VERDICT
Australia wins the demand scenarios, the Middle East wins the winter:
and TTF is the risk that towers over both.
Four stress tests separate a near tie: demand skews, a Red Sea closure, seasonal spreads and index volatility. The supply choice is worth a few million; the index exposure is half a billion.
Which hub survives the stress tests.
07 · TAKEAWAYS
Australia wins most demand scenarios
It serves Korean demand better at current prices: +$7.3M when Portugal is heavy, +$5.0M under the summer skew, and still ahead when Korea is heavy.
The Middle East wins the winter skew
+$4.7M ahead when Korean contracts fall due in winter, because JKM dips in summer while Brent stays stable: the seasonal JKM-Brent spread decides it.
TTF is the risk that towers over both
A one-standard-deviation TTF move swings the book by $530.4M, five times the Henry Hub range. The supply choice is a few million; the index exposure is half a billion.
Modelled with X-LNG.
08 · THE TOOL
Your world goes in
Contracts, vessels, charter rates, prices, spot assumptions and constraints. The full book, not a slice.
One optimal plan comes out
Feasible, P&L-maximising and constraint-compliant, re-solved for every scenario in minutes.
Every number checks out
Each result can be recalculated by hand. Transparency your risk committee can audit.
CLOUD-BASED, ANY PORTFOLIO SIZE · BUILT AND ADVANCED DAILY BY ~25 MATHEMATICIANS, PHYSICISTS AND COMPUTER SCIENTISTS